Best CS2 Telemetry Binds and Scripts
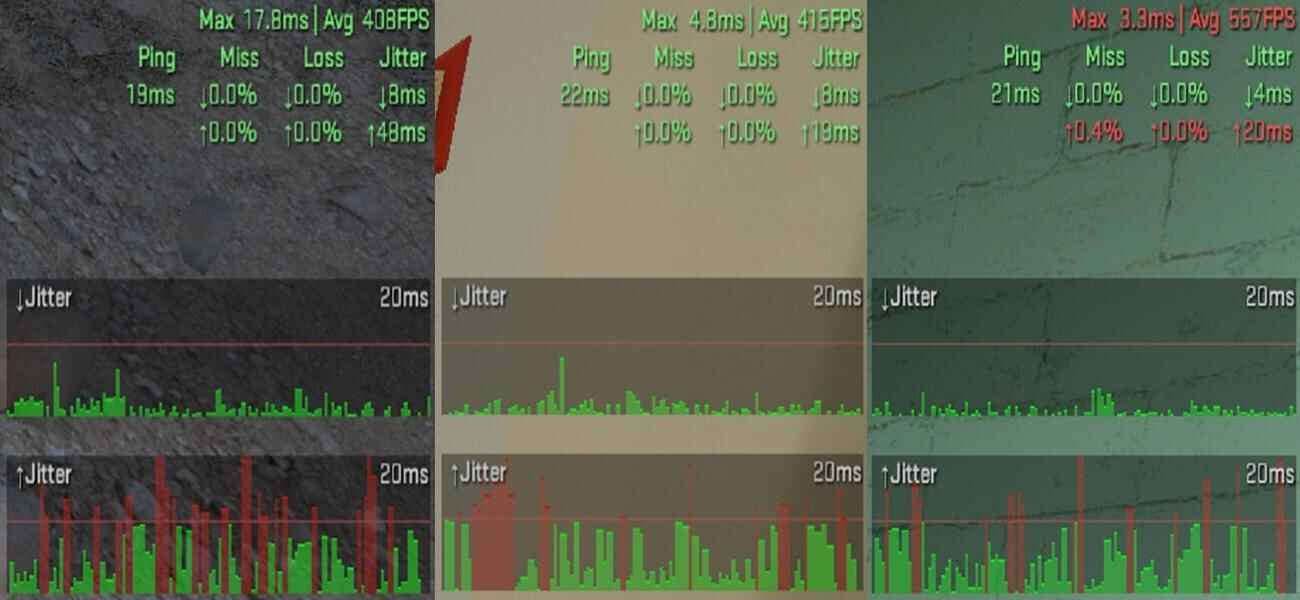
Now let’s look at a few ways to build telemetry scripts in Counter-Strike 2. You can bind a key to show performance data only when needed. Some players prefer a press-and-release version, while others use a toggle. Both work well - the choice depends on whether you want telemetry to appear briefly or stay on screen longer.
Press & Release Telemetry Script
This is the simplest and most natural option. You press and hold a key to see your performance and network stats - and everything disappears as soon as you release it. That means your HUD stays clean during fights, but you can always pull up detailed stats on demand.
alias +drow_stat "cl_hud_telemetry_frametime_show 2; cl_hud_telemetry_ping_show 2; cl_hud_telemetry_net_detailed 2; cl_hud_telemetry_net_misdelivery_show 2; cl_hud_telemetry_net_quality_graph_show 2"
alias -drow_stat "cl_hud_telemetry_frametime_show 0; cl_hud_telemetry_ping_show 0; cl_hud_telemetry_net_detailed 0; cl_hud_telemetry_net_misdelivery_show 0; cl_hud_telemetry_net_quality_graph_show 0"
bind "v" "+drow_stat"
Updated: With Scoreboard (TAB)
A better variation is to combine telemetry with the scoreboard. Every time you press TAB to check scores, telemetry also appears. This way you don’t need an extra key, and performance stats become part of your natural routine.
alias +drow_stat "cl_hud_telemetry_frametime_show 2; cl_hud_telemetry_ping_show 2; cl_hud_telemetry_net_detailed 2; cl_hud_telemetry_net_misdelivery_show 2; cl_hud_telemetry_net_quality_graph_show 2; +showscores"
alias -drow_stat "cl_hud_telemetry_frametime_show 0; cl_hud_telemetry_ping_show 0; cl_hud_telemetry_net_detailed 0; cl_hud_telemetry_net_misdelivery_show 0; cl_hud_telemetry_net_quality_graph_show 0; -showscores"
bind "TAB" "+drow_stat"
This makes telemetry feel seamless and ensures you only see it when you're not actively fighting.
Toggle Telemetry Script
If you’d rather enable telemetry for longer periods without holding a key, use a toggle script. Press once to turn it on, and press again to turn it off.
alias "telemetry" "drow_stat_on"
alias drow_stat_on "cl_hud_telemetry_frametime_show 2; cl_hud_telemetry_ping_show 2; cl_hud_telemetry_net_detailed 2; cl_hud_telemetry_net_misdelivery_show 2; cl_hud_telemetry_net_quality_graph_show 2; alias telemetry drow_stat_off"
alias drow_stat_off "cl_hud_telemetry_frametime_show 0; cl_hud_telemetry_ping_show 0; cl_hud_telemetry_net_detailed 0; cl_hud_telemetry_net_misdelivery_show 0; cl_hud_telemetry_net_quality_graph_show 0; alias telemetry drow_stat_on"
bind "v" "telemetry"
It can also be written as a toggle bind:
bind "v" "toggle cl_hud_telemetry_frametime_show 2 0; toggle cl_hud_telemetry_ping_show 2 0; toggle cl_hud_telemetry_net_detailed 2 0; toggle cl_hud_telemetry_net_misdelivery_show 2 0; toggle cl_hud_telemetry_net_quality_graph_show 2 0"Alias vs. Toggle Binds
The alias version runs silently and always sets the exact values you want. The toggle version spams the console with messages and depends on the current state of each variable, which can sometimes be inconsistent. For stability and clarity, aliases are the better choice here.
Add cl_showfps for Full Diagnostics
You can extend either script to include cl_showfps, which shows smoothed FPS values and frame timing stats. This makes the overlay even more powerful for diagnosing performance drops.
Alias version with cl_showfps:
alias "telemetry" "drow_stat_on"
alias drow_stat_on "cl_hud_telemetry_frametime_show 2; cl_hud_telemetry_ping_show 2; cl_hud_telemetry_net_detailed 2; cl_hud_telemetry_net_misdelivery_show 2; cl_hud_telemetry_net_quality_graph_show 2; cl_showfps 2; alias telemetry drow_stat_off"
alias drow_stat_off "cl_hud_telemetry_frametime_show 0; cl_hud_telemetry_ping_show 0; cl_hud_telemetry_net_detailed 0; cl_hud_telemetry_net_misdelivery_show 0; cl_hud_telemetry_net_quality_graph_show 0; cl_showfps 0; alias telemetry drow_stat_on"
bind "v" "telemetry"
Bind toggle version with cl_showfps:
bind "v" "toggle cl_hud_telemetry_frametime_show 2 0; toggle cl_hud_telemetry_ping_show 2 0; toggle cl_hud_telemetry_net_detailed 2 0; toggle cl_hud_telemetry_net_misdelivery_show 2 0; toggle cl_hud_telemetry_net_quality_graph_show 2 0; toggle cl_showfps 2 0"How to Create & Load CS2 Telemetry Scripts
You don’t need to re-type commands in the developer console every time you launch the game. The smarter way is to save your scripts into configuration files (.cfg) so they can be executed manually or even loaded automatically at startup. This makes your setup permanent and easy to manage.
CS2 scripts are based purely on Source 2’s native console commands. They don’t rely on external software or third-party tools, which means they are safe to use in game - VAC system will not ban you for alias or toggle commands. The only exception could be certain third-party leagues or private servers that apply their own rules, so always double-check if you play outside of Valve’s official matchmaking.
Here are the main ways to create and load scripts and binds in Counter-Strike 2.
Create the .cfg file
First, locate your CS2 configuration folder:
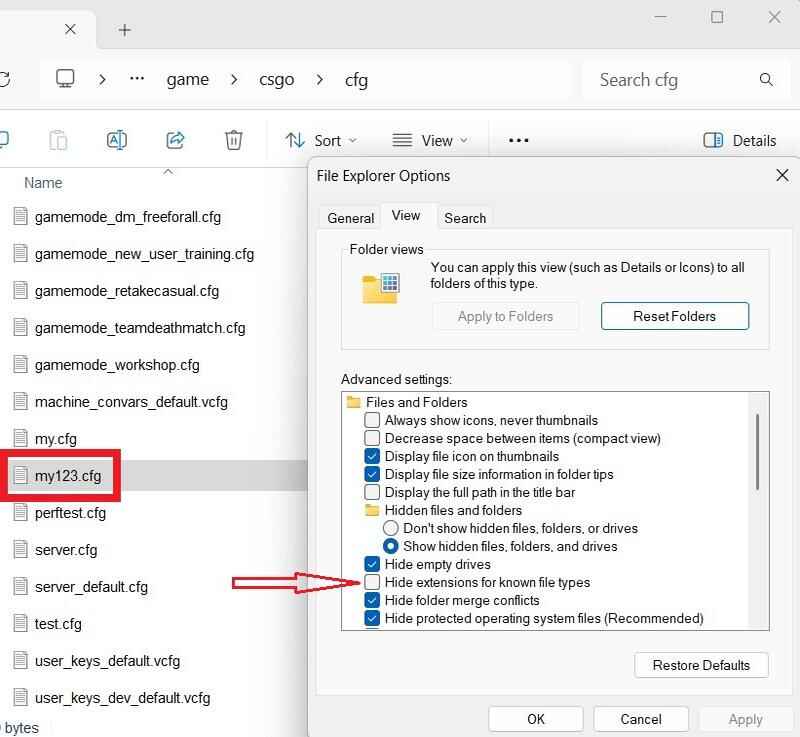
..\steamapps\common\Counter-Strike Global Offensive\game\csgo\cfg\Inside that folder, create a new text file. You can name it with letters, numbers, underscores, or dashes (e.g, my123.txt). Then change the file extension from .txt to .cfg (e.g, my123.cfg).
If you don’t see file extensions in Windows, open Control Panel -> File Explorer Options -> View tab, and uncheck "Hide extensions for known file types".
Open it with a text editor like Notepad, paste in your script(s), and save. The file is now ready to be executed inside CS2.
Load via Console (exec)
- Launch Counter-Strike 2.
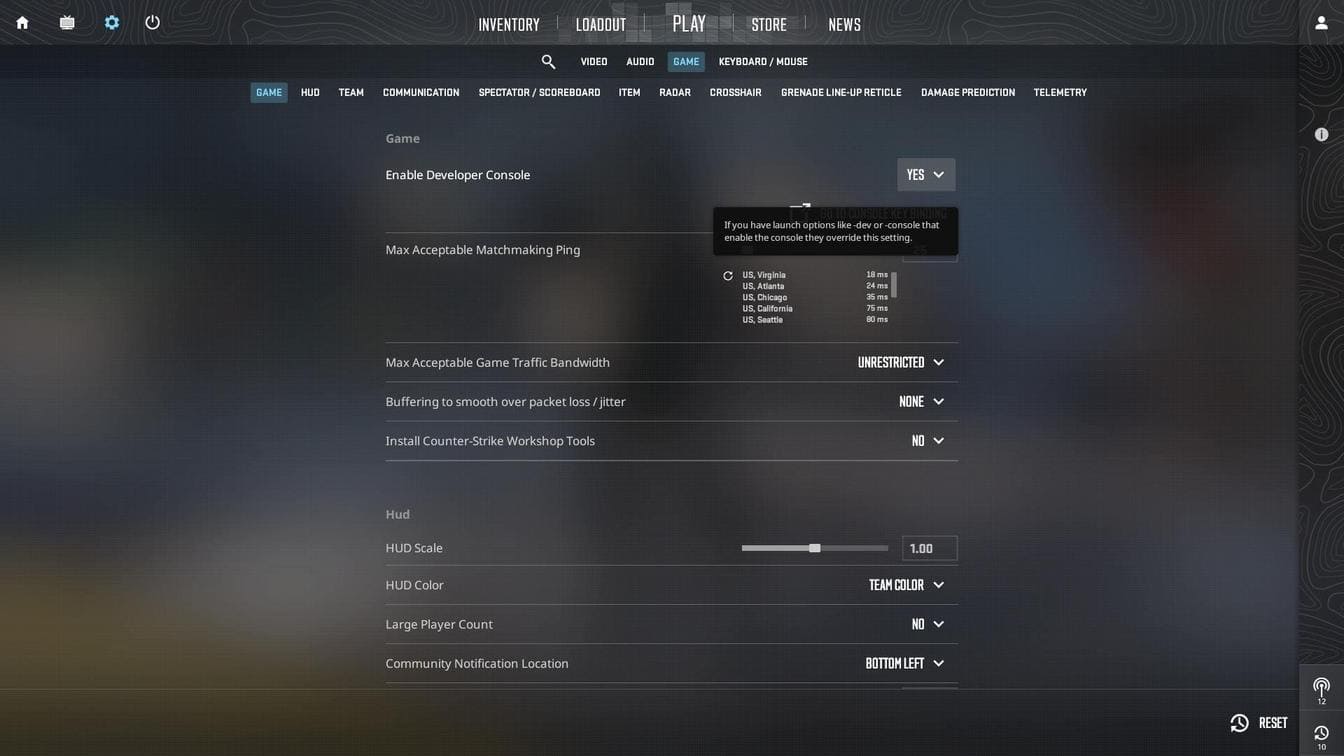
- Go to Settings -> Game and set Enable Developer Console to Yes.
- Press the
~key (default) to open the console. - Type:
exec my123 - Hit Enter, close the console, and your script will be active.
This method is fine for testing or when you want manual control.
Auto-run via Steam Launch Options
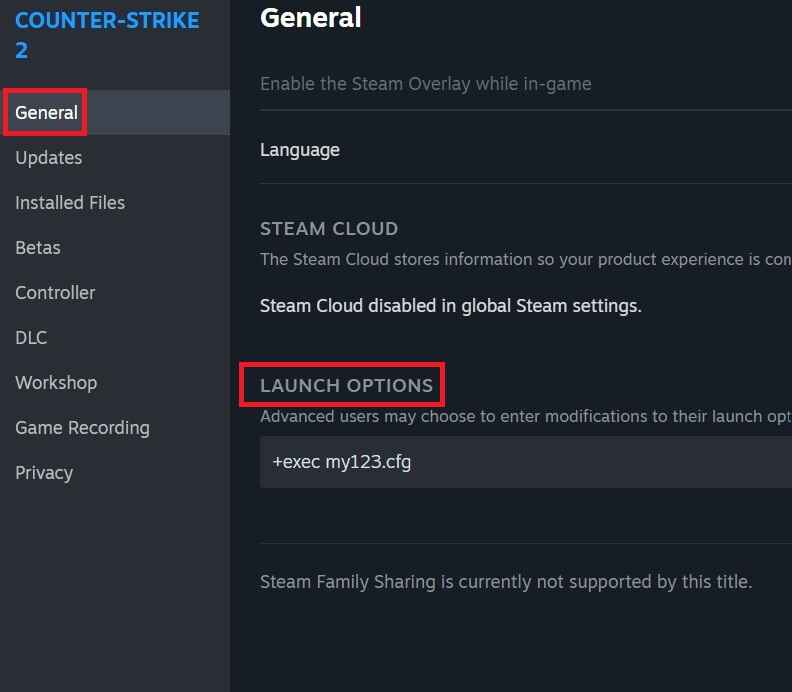
- Open Steam, right-click Counter-Strike 2, and select Properties.
- Under the General tab, find Launch Options.
- Add this:
+exec my123.cfg
Now your script will run automatically at every launch without extra steps.
Auto-run via autoexec.cfg

- In the CS2 \cfg\ folder, create
autoexec.cfgfile. - Add inside:
exec my123.cfgor you commands, binds and/or scripts. - (Optional) Organize scripts in subfolders:
- Place the file in
/cfg/myscripts/folder and run:exec myscripts/my123.cfg
- Place the file in
For more tips on managing configs, check out these guides:
CS2 Telemetry Scripts FAQ

How can I make telemetry appear only when I press TAB?
Bind telemetry together with the scoreboard using an alias script (show on TAB).
What’s the difference between alias and toggle?
The alias command sets exact values and runs silently; toggle command flips cvars based on current state and spams the console.
Where are my configs saved?
Inside the CS2 configs folder: ..\steamapps\common\Counter-Strike Global Offensive\game\csgo\cfg\
Can I run my old CS:GO net_graph configs in CS2?
No, the net_graph command is deprecated.
What if my telemetry overlay doesn’t show?
Check that the script was executed (exec my123), values are set to 1 or 2, and that no other binds overwrite your key.
Does telemetry affect game performance?
Slightly. Running detailed graphs all the time may reduce FPS. Use scripts to toggle on/off as needed.