Counter-Strike 2 has introduced a new feature called Telemetry, replacing the traditional net_graph command from previous versions of Counter-Strike. Let’s take a look at Telemetry, including its history, available commands, and how to utilize it for monitoring game performance.
History of Telemetry in CS2
In earlier iterations of Counter-Strike, players relied on the net_graph command. The net_graph console command in Counter-Strike (especially in CS:GO, and also present in earlier versions like CS:Source and CS 1.6) is used to display real-time statistics such as Frames Per Second (FPS), ping, and network stats (packet loss).
When net_graph is enabled, you’ll usually see it appear at the bottom of the screen (by default): FPS – Your current framerate Ping – The latency between your client and the server (in ms) Loss – Percentage of packets lost between client and server Choke – Packets held back by the server due to bandwidth issues Tickrate – Server update rate (usually 64 or 128 ticks) sv / var / cmd – Server performance stats (frame processing time, variance, etc.)
It’s useful for troubleshooting lag spikes, checking if you’re dropping frames or packets, monitoring server performance (especially in competitive play), and optimizing your settings.
With the release of CS2, the net_graph command was deprecated in favor of the more comprehensive Telemetry system. This new system offers enhanced performance diagnostics and a more user-friendly interface.
Accessing Telemetry Settings
Telemetry settings can be accessed and configured directly through the in-game menu.
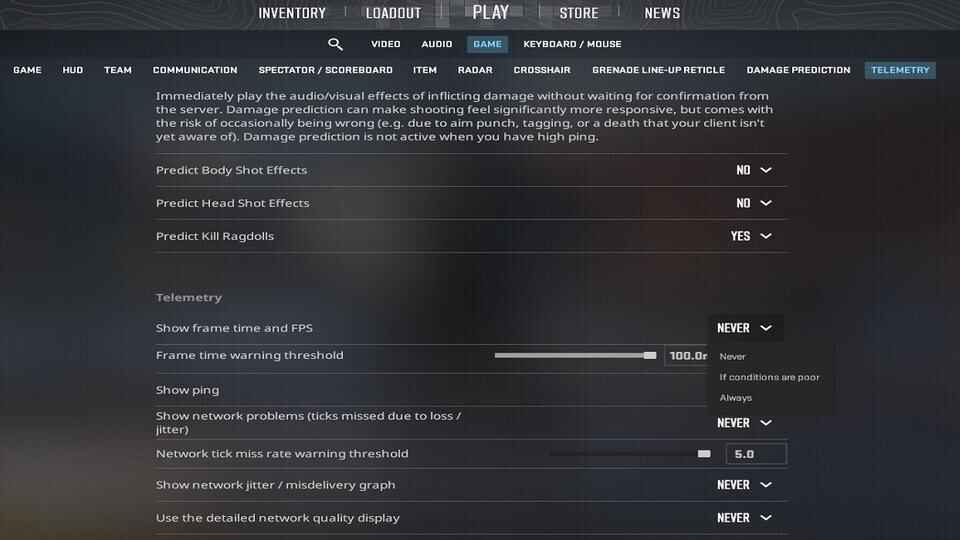
Launch the game and open settings by click on the gear icon in the main menu. Navigate to the “GAME” tab and then “TELEMETRY” tab or scrool bottom the page to get the “TELEMETRY” section.
Adjust the Telemetry options based on your preferences.
Show Frame Time and FPS
Shows the worst recent frame time in milliseconds and the current average frames per second.
Frame time warning threshold
When the frame time exceeds this value, conditions are considered “poor”.
Show Ping
Shows the round trip latency (time in milliseconds) to the server.
Show network problems
Shows the percentage of ticks that are not available at the time they are needed, due to network loss or late delivery. The rate in each direction (upstream to the server and downstream from the server) is displayed. Network misdeliveries can often be filled in with extra buffering. This number only counts ticks that are missed due to network misdelivery and not corrected.
Network tick miss rate warning threshold
When the percentage of ticks missed due network misdelivery exceeds this value, conditions are considered “Poor”.
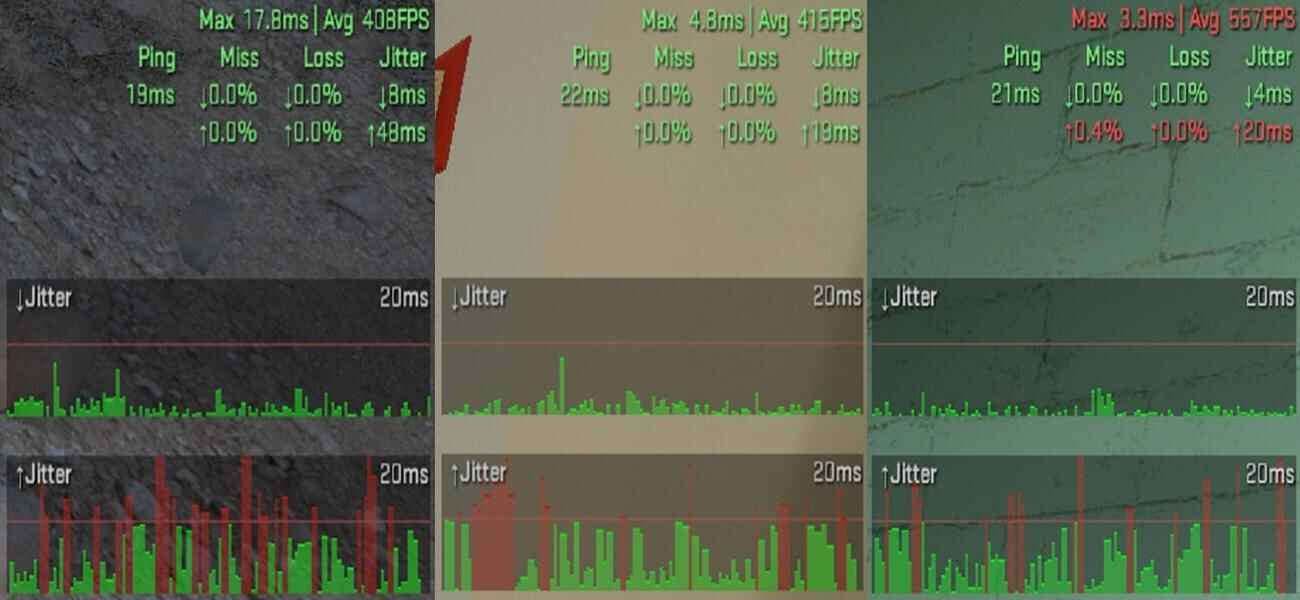
Show network / misdelivery graph
Show a realtime graph of network jitter. Misdelivery events (loss, reordering, or excessive jitter) are highlighted.
Use the detailed network quality display
Display network information on two lines. In addition to the ping and missed tick rate, the also shows are raw packet loss and jitter measurements.
The option can be set to: Never – Do not display the metric. If conditions are poor – Display the metric only when performance issues are detected. Always – Constantly display the metric.
Configuring these settings allows you to monitor game performance metrics directly on your HUD.
Telemetry Console Commands
For players who prefer to use the Developer Console, CS2 provides the commands to control the telemetry features. Let’s take a closer look.
cl_hud_telemetry_frametime_show 0/1/2
0 – Never show 1 – Show only if conditions are poor 2 – Always show
Shows or hides the worst recent frame time in milliseconds, and the current average frames per second.
cl_hud_telemetry_frametime_poor 0 – 100.0
100.0ms=10FPS
When the frame time exceeds this value, conditions are considered “poor”.
cl_hud_telemetry_ping_show 0/1/2
0 – Never show 1 – Show only if conditions are poor 2 – Always show
Shows or hides the round trip latency to the server.
cl_hud_telemetry_net_misdelivery_show 0/1/2
0 – Never show 1 – Show only if conditions are poor 2 – Always show
Shows or hides network failure indicators (e.g. packet loss, out-of-order packets). “Misdelivery” means packets were lost, delayed, or couldn’t be processed on time.
cl_hud_telemetry_net_misdelivery_poor 0.0 – 2.0
When the percentage of ticks missed due network misdelivery exceeds this value, conditions are considered “Poor”.
cl_hud_telemetry_net_detailed 0/1/2
0 – Never show 1 – Show only if conditions are poor 2 – Always show
Shows or hides additional network data, including more accurate packet loss statistics, incoming and outgoing traffic, segment delays, and potential bursts of network instability.
cl_hud_telemetry_net_quality_graph_show 0/1/2
0 – Never show 1 – Show only if conditions are poor 2 – Always show
Shows or hides the network quality graph, which visualizes connection stability, including latency spikes, packet loss, and timing inconsistencies over time.
Execute Console Commands in CS2
Launch Counter-Strike 2.
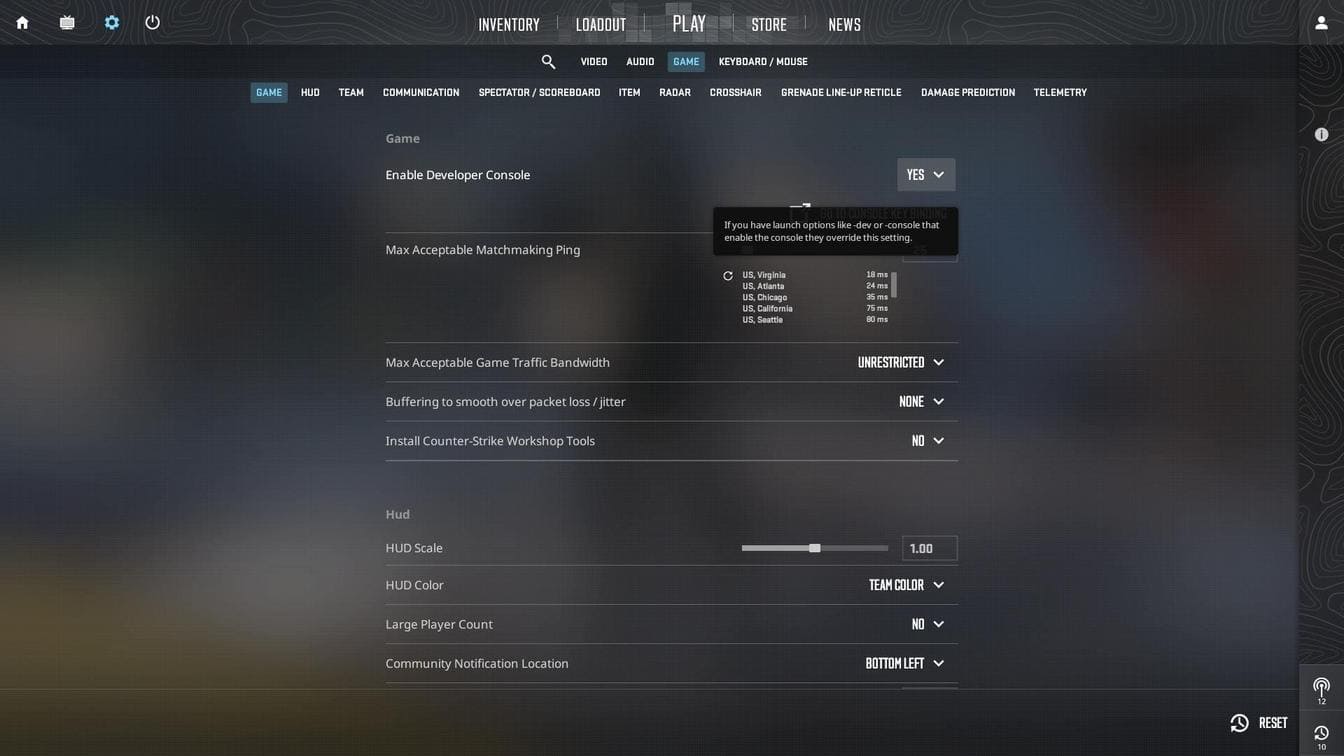
Navigate to Settings > Game.
Set “Enable Developer Console” to “Yes“.
Open the console by pressing the ~ key (default).
Enter desired command/s. For example, to always display FPS and frame time:
cl_hud_telemetry_frametime_show 2
Press Enter after typing each command.
Close the console by pressing ~ again and test the result in-game.
Alternative Command to Display Performance Metrics
In addition to Telemetry, CS2 provides the “cl_showfps0/1/2/3/4″ command to monitor performance.
cl_showfps 0 – Off. cl_showfps 1 – Displays current FPS in the top-left corner.
cl_showfps 2 – Displays FPS along with smoothing stats, frame timing (frametime), and some rolling averages. Good for basic performance profiling.
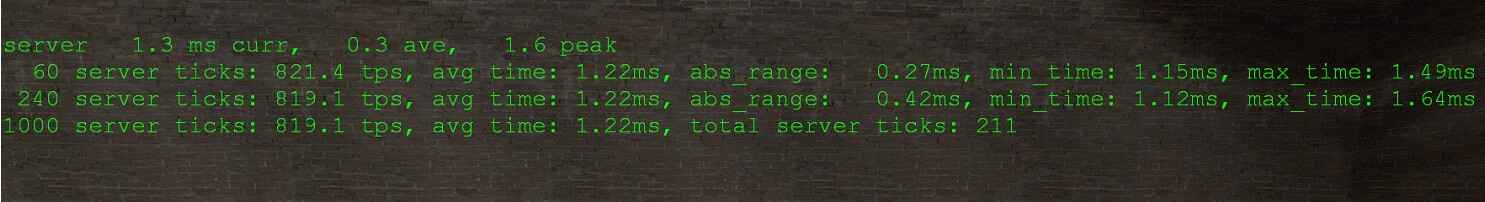
cl_showfps 3 – Adds server-side timing information (tick rate, server response), showing how the server is handling your inputs. Useful for server performance diagnostics.
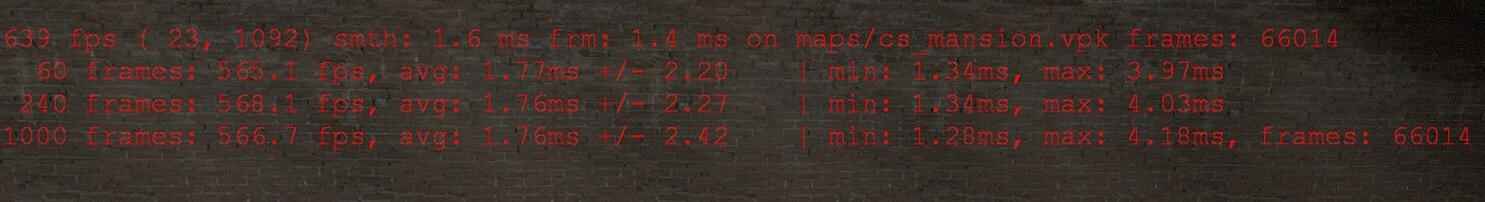
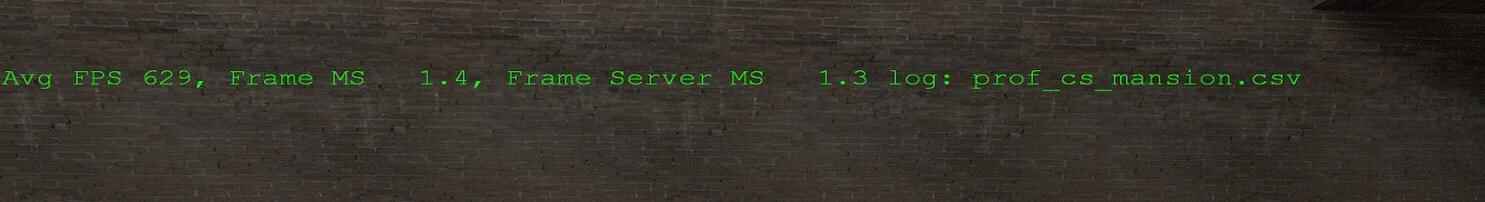
cl_showfps 4 – Summary overlay after performance profiling. Shows average FPS, frame render time, server frame time, and log file name where profiling data is saved (CSV).
Tips
Avoid keeping telemetry on at all times — constant telemetry display (especially with detailed graphs) may slightly reduce game performance. Use it primarily for testing, diagnostics, or performance analysis when needed.
Use bind or toggle scripts for quick access — create meta scripts with + / – binds (e.g., bind a key to show/hide telemetry) or toggle scripts (1/0 or True/False) to enable and disable telemetry features on the “fly”. This helps you monitor stats only when necessary without cluttering your screen.
Profiling logs are auto-saved — when using cl_showfps 4, the game generates a log file (e.g., prof_cs_mansion.csv) containing FPS and frame timing data. You can find this log here:
					\steamapps\common\Counter-Strike Global Offensive\game\csgo\
(Note: It’s stored alongside .vpk map files.)
Compare different sessions or maps — use the .csv logs to benchmark various maps, graphics settings, or system tweaks by comparing FPS and frame time ranges.
Combine with network telemetry — for deeper diagnostics, use both cl_showfps and cl_hud_telemetry_ commands together to correlate frame issues with network instability.
Watch for red/yellow spikes — visual cues like red bars or high jitter in the telemetry graph often indicate instability, making it easier to detect real-time issues.