CS2 Telemetry vs Net Graph: What Changed?

net_graph command
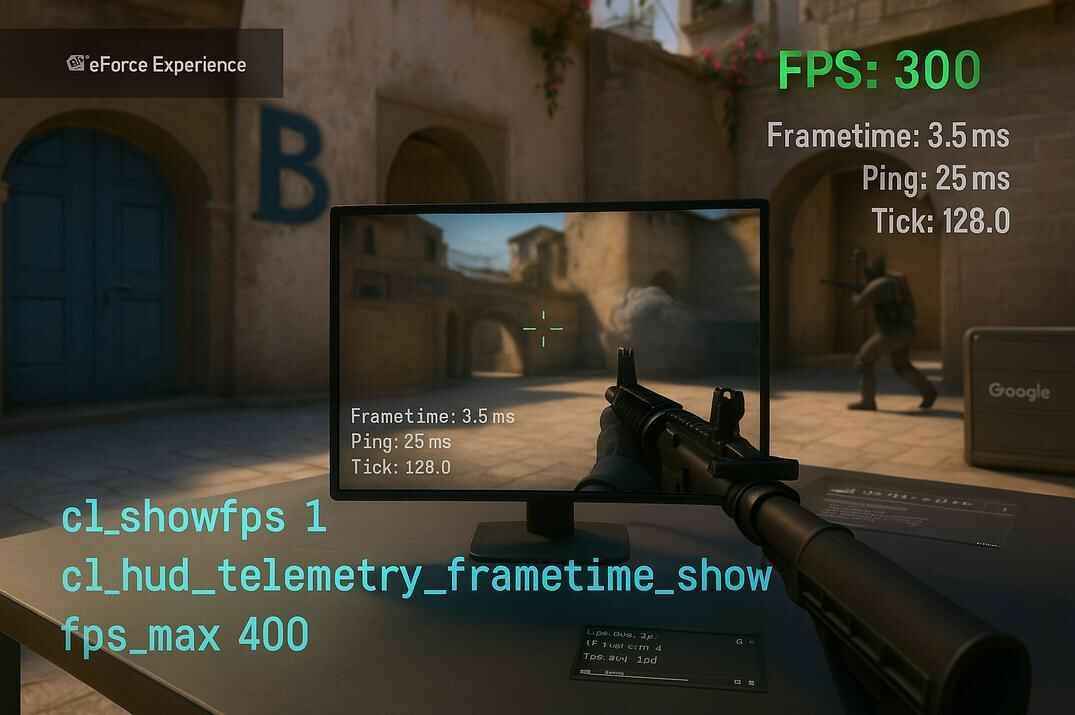
In older versions of Counter-Strike, players relied on the simple net_graph overlay to check FPS and ping. CS2 took that idea and rebuilt it from scratch, creating Telemetry - a cleaner, more detailed tool built directly into the HUD. Instead of a wall of numbers, you now get easy-to-read stats that actually help you understand if a problem comes from your PC, your connection, or the server itself.
Core Telemetry Metrics in CS2
When you turn on Telemetry, six numbers matter the most:
- FPS (Frames Per Second): shows how smoothly your game is running overall.
- Frame Time: tells you how long each frame takes to render - more accurate than just average FPS.
- Ping: your delay to the server, measured in milliseconds.
- Packet Loss: percentage of data that never makes it to the server (or back to you).
- Jitter: variation in ping - even with low ping, high jitter means unstable gameplay.
- Missed Ticks: when the server doesn’t deliver updates on time, causing micro-lags or stutter.
These numbers are the backbone of CS2 Telemetry. Once you know what they mean, you can quickly spot if it’s your PC, your network, or the server that’s holding you back.
How to Turn On Telemetry in CS2
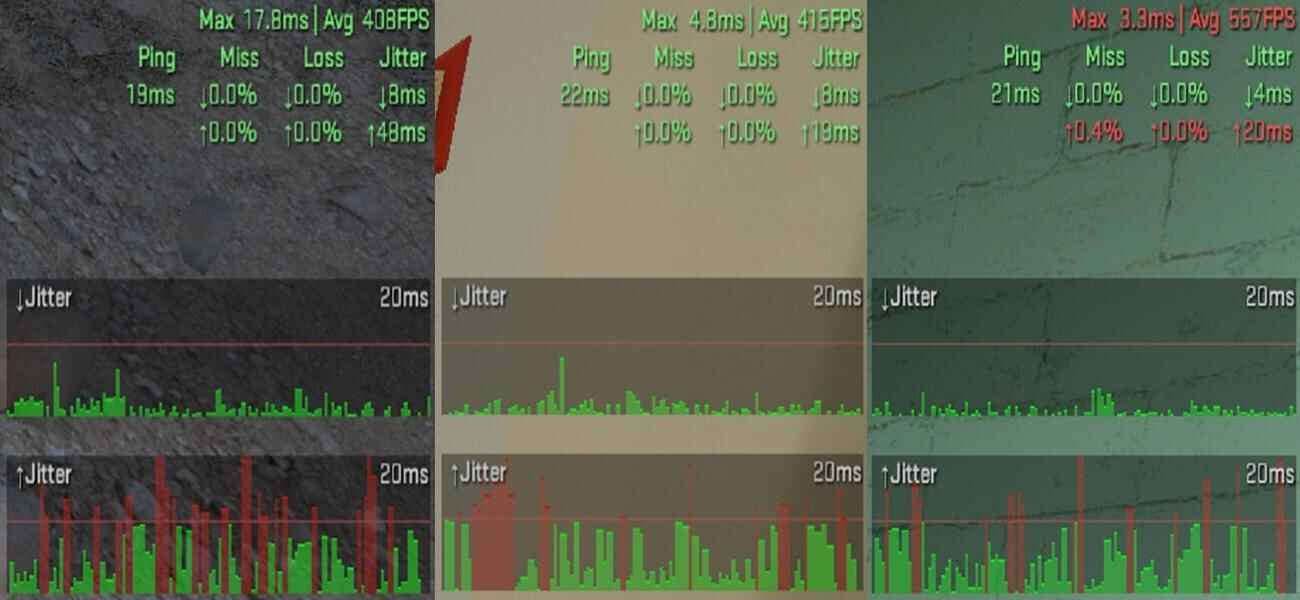
Turning on Telemetry only takes a minute, and you can do it in two ways: straight from the settings menu or with console commands if you want more control.
Enable via Game Settings
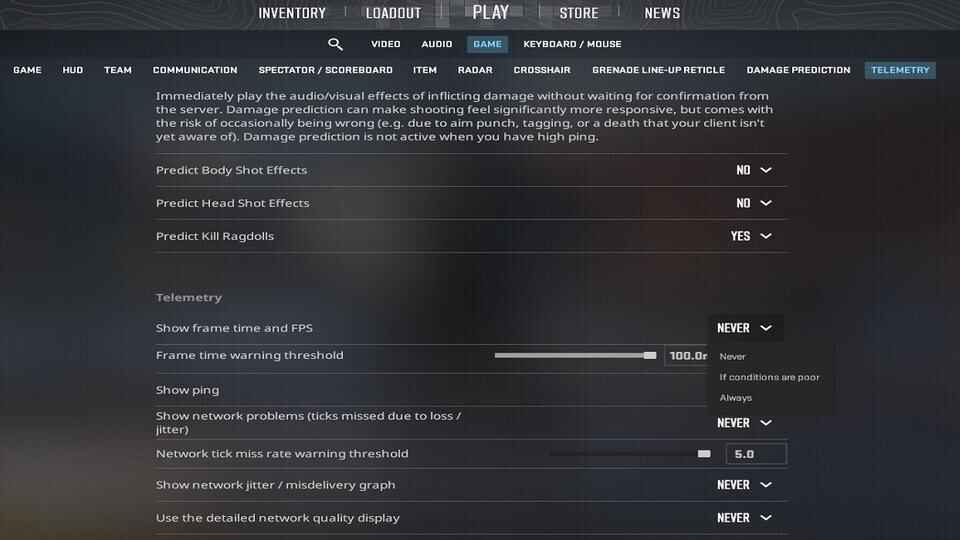
- Launch CS2 and click the gear icon in the main menu
- Go to the Game tab.
- Scroll down to the Telemetry section
- Switch on the metrics you want (FPS, Ping, Network stats)
- Choose whether to show them Always, Only if poor, or Never
That’s it - your chosen numbers will now appear directly on your HUD.
Enable via Console: CS2 Telemetry Commands
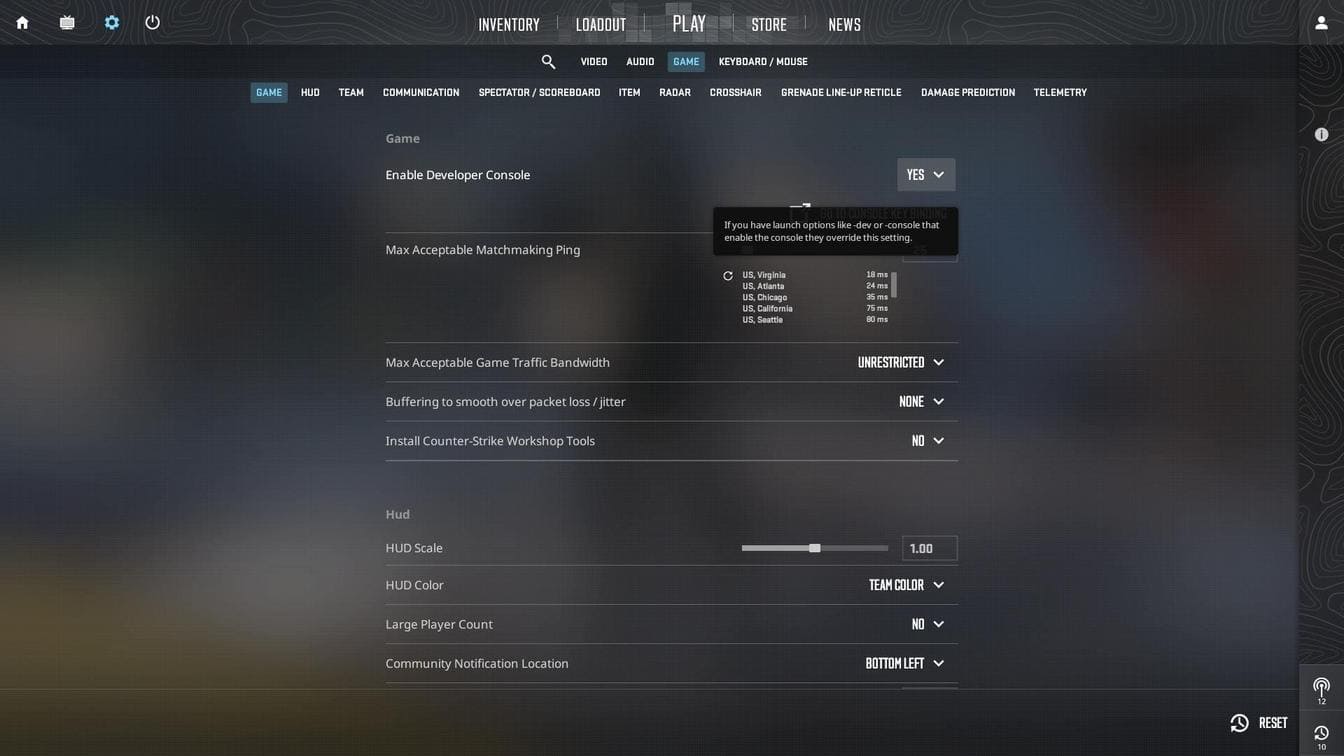
If you prefer the developer console, CS2 gives you more flexibility. First, make sure the console is enabled:
- Go to Settings -> Game -> Enable Developer Console -> Yes
- Press
~(tilde) to open it
Now you can use commands like:
cl_hud_telemetry_frametime_show 2
// Always show frame time (FPS) in the HUD

cl_hud_telemetry_frametime_poor 100
// Frame time above this is considered "poor" (1-100ms, 100ms = 10FPS, default 100)

cl_hud_telemetry_ping_show 2
// Always show ping in the HUD

cl_hud_telemetry_net_misdelivery_show 2
// Always show percentage of missed user commands & snapshots

cl_hud_telemetry_net_misdelivery_poor 5
// Anomaly rate higher than this is "poor" (0-100, default 5)

cl_hud_telemetry_net_quality_graph_show 2
// Show packet jitter and loss/reordering in the HUD

cl_hud_telemetry_net_detailed 2
// Show detailed breakdown: loss, late delivery, peak jitter

cl_hud_telemetry_serverrecvmargin_graph_show 2
// Show server recv margin graph; how early/late commands arrive
All of these commands use the same logic: 0 = Never, 1 = Only if poor, 2 = Always.
Manage CS2 Telemetry via Binds or Scripts
For convenience, you can assign keys to quickly enable, toggle, or disable telemetry.
Simple Bind
bind "c" "cl_hud_telemetry_frametime_show 2"
bind "v" "cl_hud_telemetry_frametime_show 0"
Press C to instantly show the telemetry overlay, and V to hide it.
Toggle Bind
The toggle command lets you switch between values with one key:
bind "c" "toggle cl_hud_telemetry_frametime_show 2 0"Pressing C will now hide or show telemetry instantly - perfect if you want a clean HUD most of the time, but need quick diagnostics.
Simple Script (toggle)
An alias script to handle toggling smoothly, especially for longer command chains:
alias "telemetry" "fps_on"
alias fps_on "cl_hud_telemetry_frametime_show 2; alias telemetry fps_off"
alias fps_off "cl_hud_telemetry_frametime_show 0; alias telemetry fps_on"
bind "c" "telemetry"
Now pressing C will toggle telemetry on and off, just like the toggle bind.
Press & Release Script
This script shows telemetry only while holding down the key:
alias +draw_stat "cl_hud_telemetry_frametime_show 2"
alias -draw_stat "cl_hud_telemetry_frametime_show 0"
bind "c" "+draw_stat"
Hold C to display telemetry, release it to hide.
For more examples, check out my full guides: Custom Telemetry Scripts in CS2 and Counter-Strike 2 Useful Scripts - Full Guide 2026
How to Read Telemetry: Make Sense of Each Number

Here’s how to read each part of CS2 Telemetry and understand whether the problem is your PC, your internet, or the server.
FPS vs Frame Time (why ms matters more than average FPS)
FPS tells you how many frames per second your PC is producing. Frame time shows how long each frame takes in milliseconds. Even if your FPS looks fine, inconsistent frame times (spikes from 5ms to 30ms) mean stutter. That’s why frame time is often a better indicator of smooth gameplay than raw FPS.
Ping and Jitter (stable vs spiky connections)
Ping is the delay to the server - the lower, the better. But a stable 40ms is far smoother than a ping that jumps between 20ms and 80ms. Those jumps are called jitter, and they can ruin aim duels even if your average ping looks normal.
Packet Loss, Missed Ticks & Misdelivery in CS2
Packet loss happens when data never makes it to the server or back to you. Missed ticks are slightly different - they’re moments when the server doesn’t deliver updates on time. Together they cause rubber-banding, ghost shots, or delayed movement. If you see these values climbing, the problem is usually your connection, router, or ISP.
Network Quality Graph (when to turn it on)
The graph visualizes spikes in ping, jitter, and packet loss over time. Most players don’t need it always visible, but it’s useful if you’re troubleshooting lag or testing a new internet setup. Red or yellow spikes usually mean instability that you’ll feel as micro-lags.
Alternatives to CS2 Telemetry for FPS and Performance Testing
Telemetry is the main tool in CS2, but it’s not the only way to check performance. You still have the classic cl_showfps command, built-in logs, and even third-party overlays if you need them.
cl_showfps 1-4 in CS2: When and Why to Use It
The command cl_showfps gives you four levels of detail:
-
cl_showfps 1-> simple FPS counter
A minimal FPS counter in Counter-Strike 2 enabled by cl_showfps 1, showing only the raw frames per second -
cl_showfps 2-> FPS with smoothing and frame time
cl_showfps 2 - shows detailed frame performance stats like frametime averages and fluctuation range -
cl_showfps 3-> adds server timing (tick rate, response time)
cl_showfps 3 - shows server-side performance data like tick rate (TPS), average tick times, and absolute time ranges, allowing to analyze server-side input processing delays -
cl_showfps 4-> full profiling overlay with averages and a CSV log
cl_showfps 4 - a performance profiling summary with FPS averages, frame timings, and a reference to the generated CSV log




If you just want to keep an eye on frames, stick with 1 or 2. For deeper analysis, 3 and 4 are more useful.
CS2 CSV Profiling Logs: Where They Save and How to Compare Runs
When you use cl_showfps 4, CS2 automatically creates a .csv file with frame time and FPS data. You can find it in your CS2 game folder under:
..\common\Counter-Strike Global Offensive\game\csgo\Comparing these logs between maps or after changing settings is a reliable way to measure if tweaks actually improved performance.
When Third-Party FPS Overlays Make Sense in CS2
Tools like MSI Afterburner, NVIDIA GeForce Experience, or Fraps overlays can also show FPS, temps, and GPU usage. They’re great for hardware testing, but keep in mind they add extra load and can clutter your screen. For everyday play, CS2’s built-in Telemetry is usually enough. The launch option -allow_third_party_software is required here.
CS2 Telemetry FAQ

Does enabling Telemetry lower FPS?
No. CS2 Telemetry is built into the engine and only displays stats the game already tracks (FPS, ping, packet loss). Unlike third-party overlays such as MSI Afterburner or OBS, it doesn’t run extra processes. In practice, there’s no performance difference - at most you might lose 1-2 FPS on very weak PCs when the full graph is always enabled.
Which is more important - FPS or Frame Time?
Frame time. Even at high FPS, unstable frame times cause visible stutter.
What’s a good ping for CS2?
Anything under 50ms feels smooth. Above 80ms you’ll start noticing delays.
Why do I have packet loss but normal ping?
Ping only measures delay. Packet loss means data never arrives, which causes rubber-banding or ghost shots.
Can I make Telemetry show only when there are issues?
Yes. In settings, choose Show if poor for each metric.
Is cl_showfps better than Telemetry?
Telemetry is more detailed. cl_showfps is simpler if you only need FPS.
Can I toggle Telemetry with a single key?
Yes. Use a bind like: bind "x" "toggle cl_hud_telemetry_frametime_show 0 2".
What causes jitter in CS2?
Unstable internet - usually Wi-Fi, bad routing, or ISP issues.
Where can I find Telemetry logs?
Use cl_showfps 4 - the game saves a .csv log in your CS2 folder.
Why did Valve replace net_graph with Telemetry?
To modernize the overlay and make stats clearer for both casual and competitive players.