Custom Telemetry Scripts in Counter-Strike 2
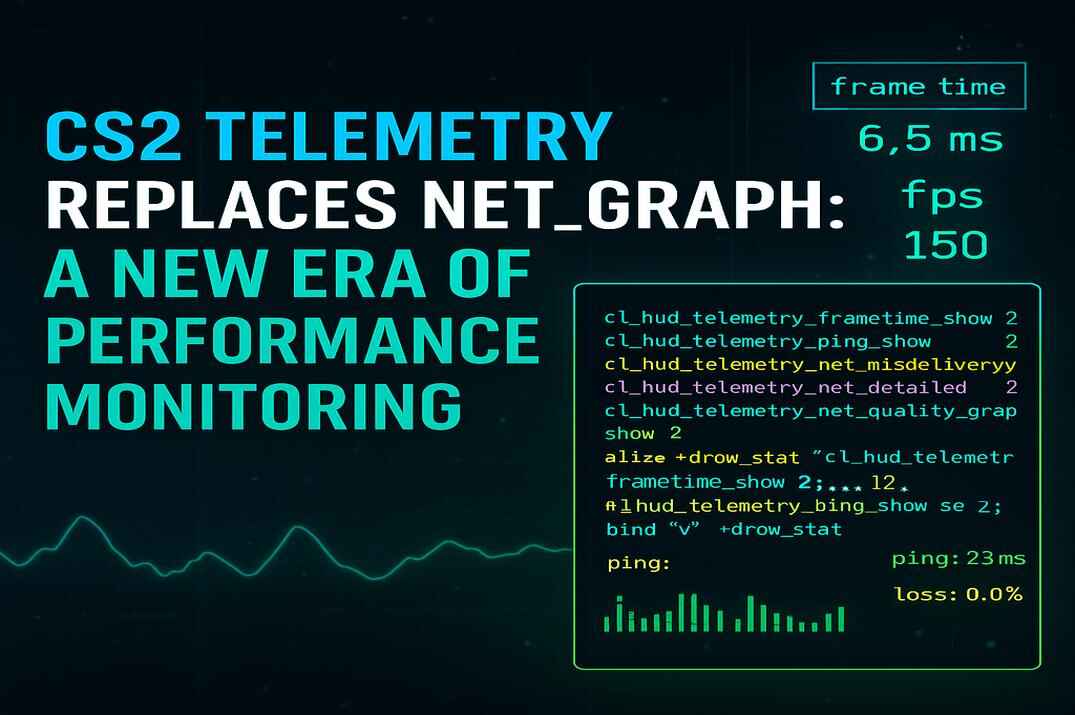
In earlier versions of Counter-Strike, players relied on the net_graph console command to monitor performance. With the release of Counter-Strike 2, this command has been deprecated and replaced by a more advanced system: Telemetry.
Telemetry is a powerful real-time performance monitoring tool that offers deeper insight into in-game metrics such as FPS, ping, and network packet loss. It allows players to track their game’s performance and network quality visually and in real time.
In this guide, I’ll show you how to create several variations of scripts that display all telemetry metrics available in CS2. You’ll learn how to build and customize these scripts to monitor performance on demand. I’ll also briefly explain what scripts, aliases, and binds are, so you can understand how they work and use them effectively in your own configurations.
Let’s get started.
What is a Script?
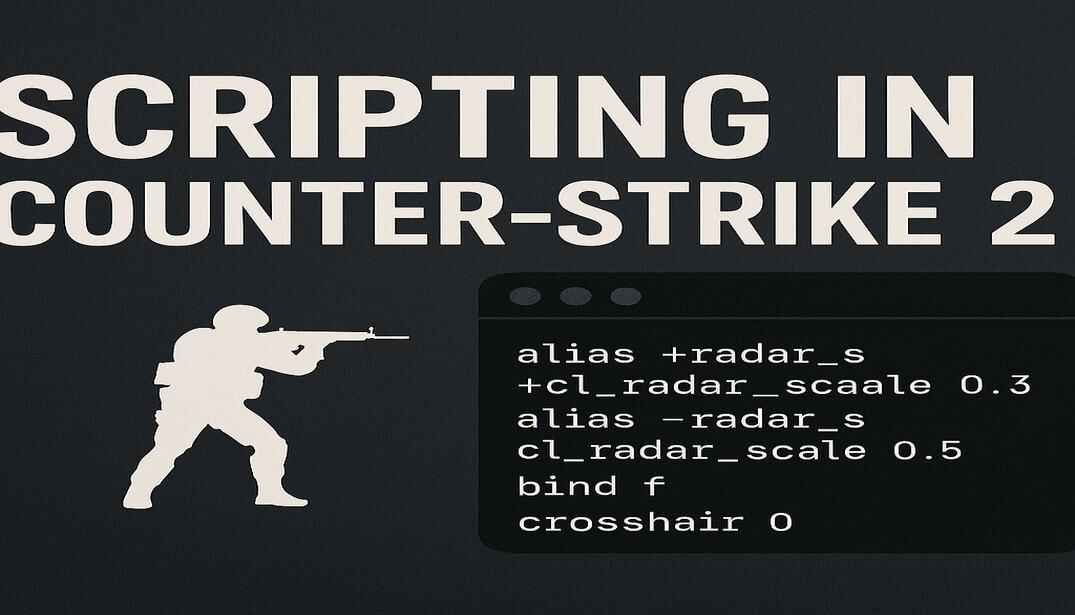
In CS2, a script is a set of console commands written in Valve’s scripting language. Scripts are usually saved in .cfg files and used to automate or customize gameplay actions. Players can run scripts at startup or trigger them in-game with specific keys.
For a more advanced scripting guide, check out: Scripting in Counter-Strike 2 | Full Guide
What are Alias and Bind?
The alias is a console command that lets you create a custom shortcut for a command or a sequence of commands. It’s useful for writing complex scripts, creating toggles, or managing advanced input behavior. It’s often used alongside bind command to customize gameplay controls.
The bind is a console command that assigns a specific in-game action to a keyboard or mouse button. This feature lets players optimize controls for convenience, efficiency, and personal preference. With key binds, you can execute actions instantly, bypassing the need to type commands or navigate menus during critical moments.
For a full breakdown and examples, check out: Bind Console Commands in Counter-Strike 2: A Complete Tutorial
Basic Syntax
alias “[alias_name]” “[command(s)]”
bind “[key/button]” “[command(s) and value(s)]”
Use semicolons to chain multiple commands.
Use descriptive alias names to stay organized.
Recognized Keyboard and Mouse Keys
Before binding, you should know the exact names of keys and mouse buttons:
- mouse1 – Left click
- mouse2 – Right click
- mouse3 – Middle click
- mwheelup / mwheeldown – Mouse wheel scroll
- space, ctrl, shift, a–z, 0–9 – Standard keys
Telemetry Options and Commands
Here are the key options:
| Command | Description |
|---|---|
|
cl_hud_telemetry_frametime_show |
Frame time and FPS |
|
cl_hud_telemetry_ping_show |
Latency (Ping) |
|
cl_hud_telemetry_net_misdelivery_show |
Network packet loss |
|
cl_hud_telemetry_net_detailed |
Real-time network jitter graph |
|
cl_hud_telemetry_net_quality_graph_show |
Detailed network data (loss, jitter, ping) |
Each telemetry command has three modes:
0 – Off
1 – Show only if performance is poor
2 – Always show
These can be shown independently or combined in a script.
Configuring these settings allows you to monitor game performance metrics directly on your HUD.
Full Telemetry tutorial: Telemetry in Counter-Strike 2 | Guide
Alternative: cl_showfps Modes
The cl_showfps 0/1/2/3/4 console command is another HUD tool:
0 – Off
1 – Simple FPS counter
2 – Adds smoothing and timing stats
3 – Server-side timing info
4 – Summary with logging (CSV export)
Custom Telemetry Scripts for CS2
Now let’s look at some telemetry script variants in Counter-Strike 2.
Variant 1: Press & Hold
					cl_hud_telemetry_frametime_show				0
cl_hud_telemetry_ping_show					0
cl_hud_telemetry_net_misdelivery_show		0
cl_hud_telemetry_net_detailed				0
cl_hud_telemetry_net_quality_graph_show		0
alias +drow_stat "cl_hud_telemetry_frametime_show 2; cl_hud_telemetry_ping_show 2; cl_hud_telemetry_net_detailed 2; cl_hud_telemetry_net_misdelivery_show 2; cl_hud_telemetry_net_quality_graph_show 2"
alias -drow_stat "cl_hud_telemetry_frametime_show 0; cl_hud_telemetry_ping_show 0; cl_hud_telemetry_net_detailed 0; cl_hud_telemetry_net_misdelivery_show 0; cl_hud_telemetry_net_quality_graph_show 0"
bind "v" "+drow_stat"
When you press and hold the v key, the +drow_stat alias activates and displays full telemetry data (FPS, ping, packet loss, network quality graph, etc).
Once you release the key, the -drow_stat alias resets everything back to hidden.
Updated: With Scoreboard (TAB)
Let’s modernize it by combining telemetry with the scoreboard (TAB key):
					alias +drow_stat "cl_hud_telemetry_frametime_show 2; cl_hud_telemetry_ping_show 2; cl_hud_telemetry_net_detailed 2; cl_hud_telemetry_net_misdelivery_show 2; cl_hud_telemetry_net_quality_graph_show 2; +showscores"
alias -drow_stat "cl_hud_telemetry_frametime_show 0; cl_hud_telemetry_ping_show 0; cl_hud_telemetry_net_detailed 0; cl_hud_telemetry_net_misdelivery_show 0; cl_hud_telemetry_net_quality_graph_show 0; -showscores"
bind "TAB" "+drow_stat"
Now, pressing TAB will show the scoreboard and telemetry together, and release will hide both.
Variant 2: Toggle Script
					alias "telemetry" "drow_stat_on"
alias drow_stat_on "cl_hud_telemetry_frametime_show 2; cl_hud_telemetry_ping_show 2; cl_hud_telemetry_net_detailed 2; cl_hud_telemetry_net_misdelivery_show 2; cl_hud_telemetry_net_quality_graph_show 2; alias telemetry drow_stat_off"
alias drow_stat_off "cl_hud_telemetry_frametime_show 0; cl_hud_telemetry_ping_show 0; cl_hud_telemetry_net_detailed 0; cl_hud_telemetry_net_misdelivery_show 0; cl_hud_telemetry_net_quality_graph_show 0; alias telemetry drow_stat_on"
bind "v" "telemetry"
This script works similarly to the press & release version, but with a toggle mechanic — press v once to show telemetry, press it again to hide it. Super convenient during gameplay.
Updated: Add cl_showfps 2 for full diagnostics
Let’s extend it to include cl_showfps 2, which shows a smoothed FPS value with frame statistics:
					alias "telemetry" "drow_stat_on"
alias drow_stat_on "cl_hud_telemetry_frametime_show 2; cl_hud_telemetry_ping_show 2; cl_hud_telemetry_net_detailed 2; cl_hud_telemetry_net_misdelivery_show 2; cl_hud_telemetry_net_quality_graph_show 2; cl_showfps 2; alias telemetry drow_stat_off"
alias drow_stat_off "cl_hud_telemetry_frametime_show 0; cl_hud_telemetry_ping_show 0; cl_hud_telemetry_net_detailed 0; cl_hud_telemetry_net_misdelivery_show 0; cl_hud_telemetry_net_quality_graph_show 0; cl_showfps 0; alias telemetry drow_stat_on"
bind "v" "telemetry"
How to Run Your Scripts in Counter-Strike 2
Scripts can be written and executed manually via the in-game developer console, but this method isn’t always convenient. A better approach is to store your scripts in a configuration file (.cfg) which can be run manually—or automatically every time the game starts.
Let’s walk through the different ways you can create and load configuration files that include your scripts, keybindings, and other commands.
Create the .cfg file
- Locate your CS2 config folder:
..\steamapps\common\Counter-Strike Global Offensive\game\csgo\cfg\ - Create a new text file in that folder. You can name it using letters, numbers, dashes, or underscores.
Example: my123.txt - Change the file extension from .txt to .cfg
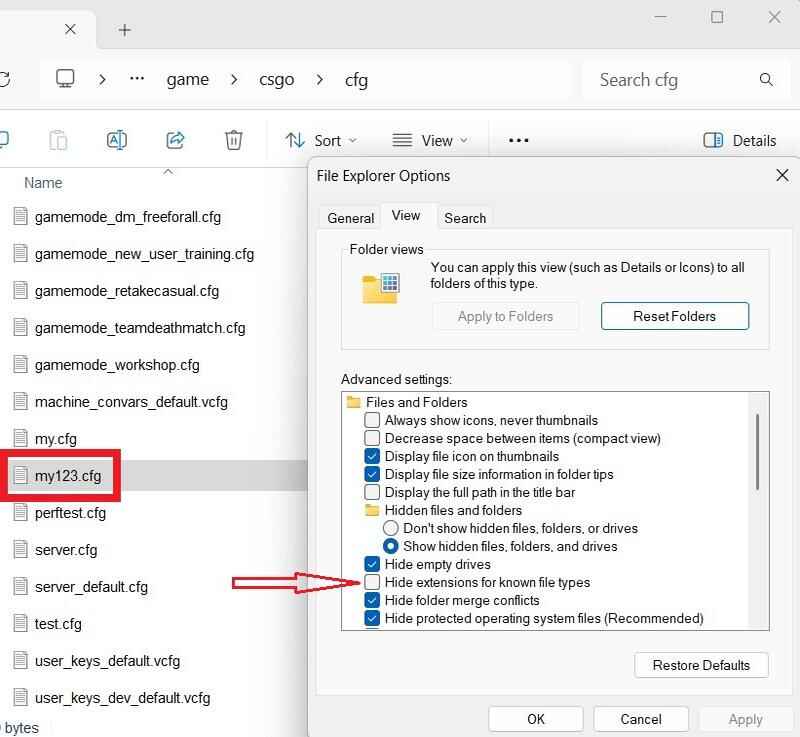
To show file extensions in Windows:
Open Control Panel → File Explorer Options → View tab, and uncheck “Hide extensions for known file types” box.
- Your final file might look like:
my123.cfg - Open the .cfg files using any text editor (like Notepad) and add your desired script(s).
- Once saved, the file can be executed using one of the methods below.
Method 1: Run via Console (Manual)
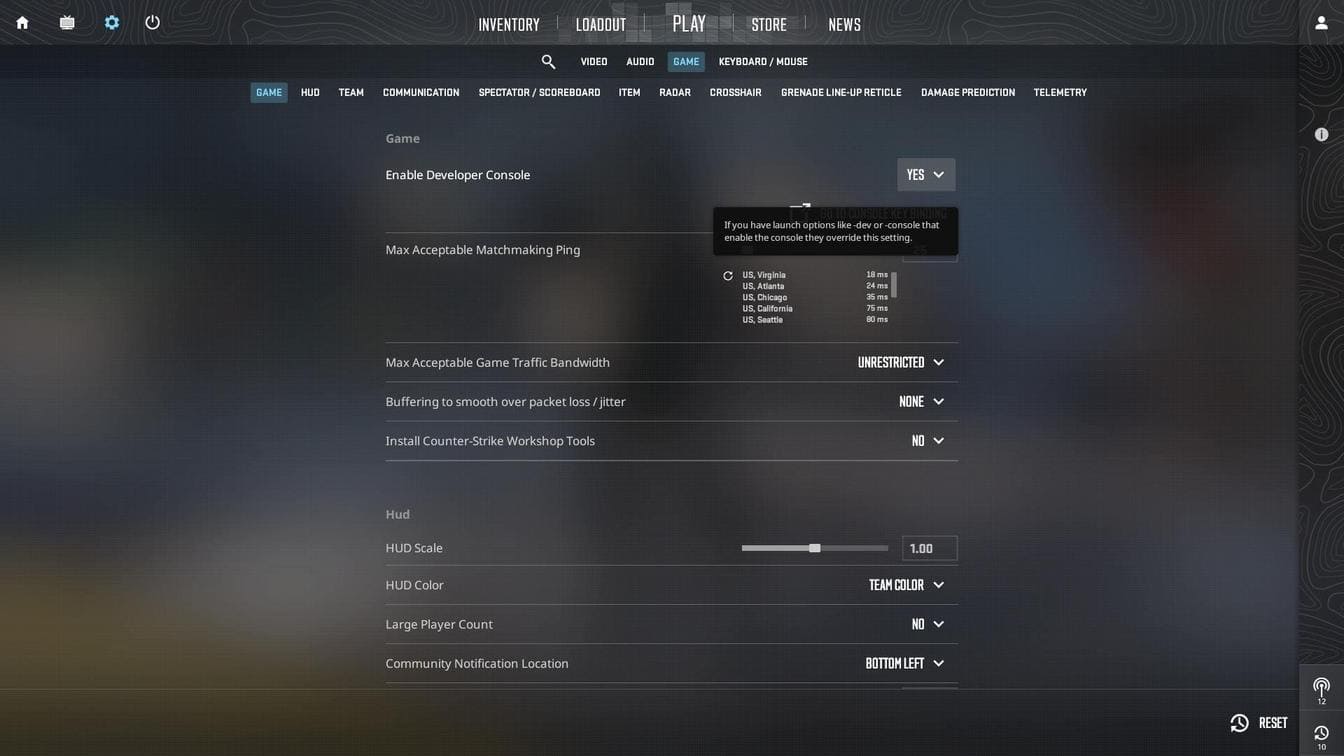
- Launch Counter-Strike 2
- Go to Settings > Game and set “Enable Developer Console” to “Yes“.
- Press the ~ key (default) to open the console
- Type the following:
exec my123 - Press Enter, then close the console (~ again) and test your script(s) in-game.
Method 2: Add to Launch Options (Auto)
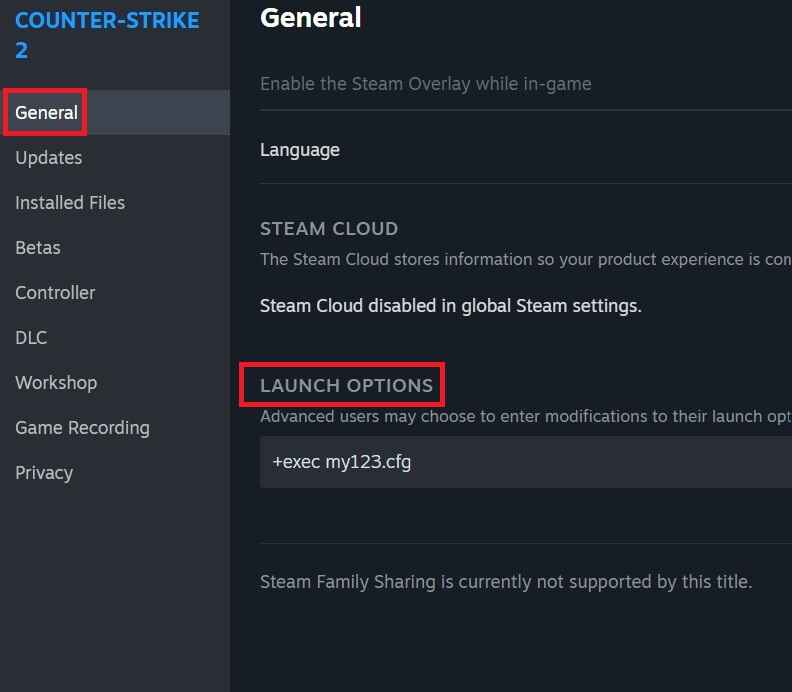
- Open Steam, right-click on Counter-Strike 2, and choose Properties.
- Under the General tab, find Launch Options.
Add the following line:
+exec my123.cfg
This will execute your script(s) automatically every time the game launches.
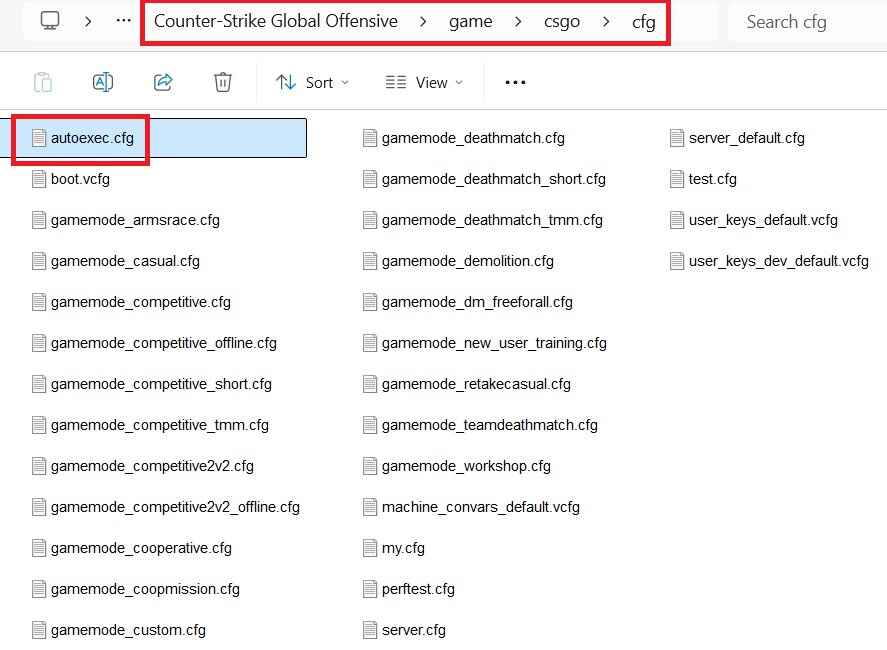
Method 3: Use the autoexec.cfg File (Auto)
In the same cfg folder, create a new file named autoexec.cfg.
The autoexec.cfg file is a legacy feature that works in all Counter-Strike games. It automatically runs every time CS2 starts, so it’s perfect for loading custom scripts, binds, and settings.
You can either:
Paste your scripts directly into autoexec.cfg, or use it to load other .cfg files like this:
exec my123.cfg
You can even organize your scripts into subfolders and load them with paths:
exec scripts/my123.cfg
Note: CS2 does not include an autoexec.cfg file by default, you must create it yourself.
For advanced setup tips, see this detailed guide:
Optimizing COUNTER-STRIKE 2 Player Configuration Files
Tips
- Avoid keeping telemetry on at all times — constant telemetry display (especially with detailed graphs) may slightly reduce game performance. Use it primarily for testing, diagnostics, or performance analysis when needed.
- Use bind or toggle scripts for quick access — create meta scripts with + / – binds (e.g., bind a key to show/hide telemetry) or toggle scripts (1/0 or True/False) to enable and disable telemetry features on the “fly”. This helps you monitor stats only when necessary without cluttering your screen.
- Profiling logs are auto-saved — when using cl_showfps 4, the game generates a log file (e.g., prof_cs_mansion.csv) containing FPS and frame timing data. You can find this log here:
					\steamapps\common\Counter-Strike Global Offensive\game\csgo\
(Note: It’s stored alongside .vpk map files.)
- Compare different sessions or maps — use the .csv logs to benchmark various maps, graphics settings, or system tweaks by comparing FPS and frame time ranges.
- Combine with network telemetry — for deeper diagnostics, use both cl_showfps and cl_hud_telemetry_ commands together to correlate frame issues with network instability.
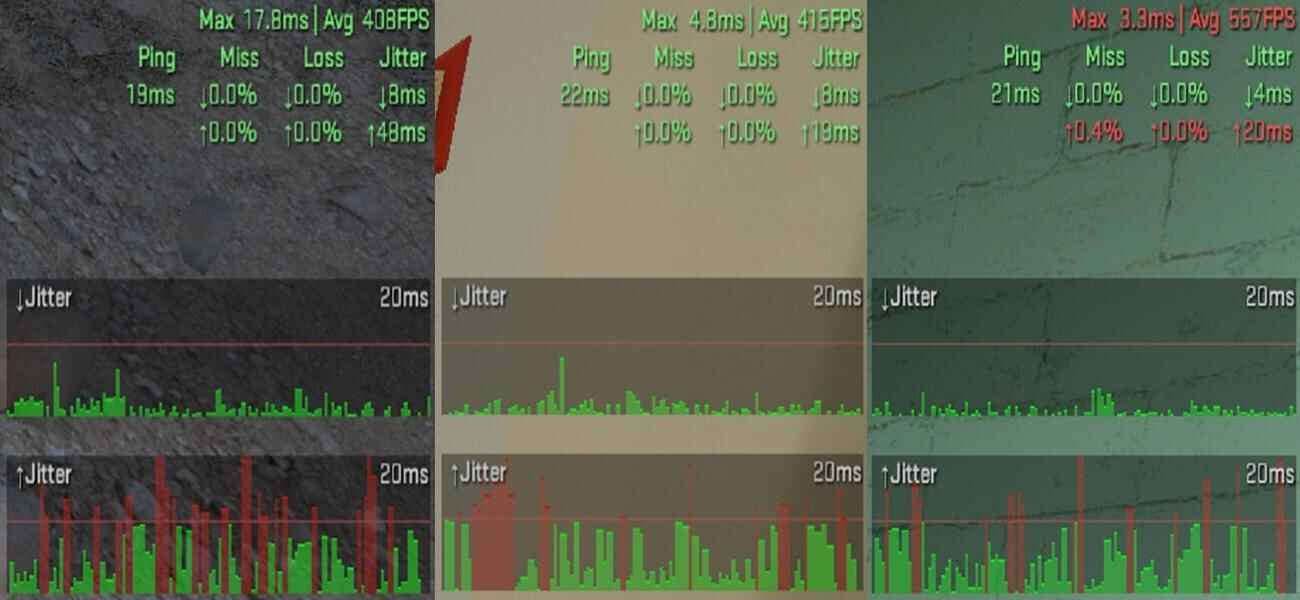
- Watch for red/yellow spikes — visual cues like red bars or high jitter in the telemetry graph often indicate instability, making it easier to detect real-time issues.
Conclusion
Creating custom telemetry scripts in CS2 gives you real-time insight into your system and network performance. Whether you’re troubleshooting packet loss, tracking FPS drops, or optimizing input latency, telemetry can become one of your most powerful tools.
By understanding how scripts, binds, and aliases work together, you can tailor your in-game HUD to your needs—on demand.
Good luck and happy fragging!